
Drivetrain Ready to dyno AGS


5th Gear
Joined: Dec 2004
Posts: 636
Likes: 0
Originally Posted by ingsoc
You do notice torque delivery, as it determines general 'character' of your car's powerband. More torque means less hesitance, especially down low. I'm pretty sure that you will feel the low-end power of the AGS, because literally everyone I know (>5!!!) who has driven with it has been surprised by how smooth and quickly the car accelerates. I personally like more power down low because fact is that's where my car is most times. NOT at/near redline. 
At the end of the day, id jsut wanna see if the AGS is worth all this hype.

Thanks Matt. The only way to do a reasonable comparison is to have each represented on the same graph. Easy enough to make the numbers say what you want them to if you try, but I think you've made a good, comparable chart.
Looks like quite a horse race! I actually like it that each comes by their (similar) power via different methods. Variety is good!
Looks like quite a horse race! I actually like it that each comes by their (similar) power via different methods. Variety is good!

3rd Gear
Joined: Jul 2005
Posts: 263
Likes: 0
Originally Posted by eMINI
It would be an exageration to say that a tenth of a second quicker 0-60 is dramatically faster, but it would put you out front by a noticeable distance. If you're interested in that kind of thing, it could be worth it.
The time to reach 60 mph is an important benchmark. For me, throttle response and mid-range power are even more important than a peak HP or Torque number. It's all about useable power. For example, I don't use the 6500-7000 rpm range all that much when compared to the 4000-6500 range. If the AGS wins in that range, it's probably my first choice.
Is AGS worth the extra money for the product and the extra labor on the install? Hmmm... that's a question we'll all have our own opinions on. But it could be.
What I'd be interested to see is a comparison of the average times for accelerating from 60-80 & 60-100. To me that would be a meaningful expression of the power increases these intakes make. I think he data is there to generate these comparisons. [ingsoc - can you help a brother out on this?]

6th Gear
Joined: Sep 2004
Posts: 5,149
Likes: 0
My post #337 touched on this but went ignored. When I am driving I don't care (much) about the extreme top. I have a 19% and try to stay away from red line. If I had an imaginary friend in a car next to me and we are cruising at say 45 (on a track of course) and he jumped on it how fast would my car respond to the now WOT condition. The faster the car gets to red line the better. This may be over simplification but speed to red line is the deal as long as it modulates well enough to be a dailey driver

Thread Starter
|
OVERDRIVE


Joined: May 2003
Posts: 7,926
Likes: 40
From: Greensboro, NC
The Alta was run with the tube ($90). JS's Mini ran quite strong inspite clearing the ECU. My Mini doesn't suffer from ECU resets either.
Originally Posted by SpiderX
there is something bothering me that no one has mentioned and maybe doesn't matter....but......whenever I reset my ECU it takes my car at least 200 miles of hard driving with a lot of WOT to teach the car that I want it to perform. The ECU has adaptive properties. When I clear my ECU, my car runs very puny and it has to adapt. It seems to me that you are not giving the ECU the time it needs to adapt and then optimize the performance of any of the intakes. Could it be that the ECU could adapt to the intakes to make better power than recorded in the test and further differentiate itself from the others?
One comment. The margin of difference is not enough for me to rip off my Alta and put on the AGS but if I were looking at this as a new purchase I might go with the AGS....like I went with the Miltek even though there are others that dyno more power. I liked the construction, the "note" and the reputation of the company.
Also, the price quoted on the Alta is without the "tube," was the test done with or w/o the tube?
what about the heat shield on the AGS?

3rd Gear
Joined: Mar 2005
Posts: 234
Likes: 0
From: Canberra, Australia
Originally Posted by mtrspt5
This whole thread is turning into a joke. For those of us who are only looking for saavy comments and not childish rants, I guess this is not the place to be. Whine, Whine Whine�

Originally Posted by SpiderX
there is something bothering me that no one has mentioned and maybe doesn't matter....but......whenever I reset my ECU it takes my car at least 200 miles of hard driving with a lot of WOT to teach the car that I want it to perform. The ECU has adaptive properties. When I clear my ECU, my car runs very puny and it has to adapt. It seems to me that you are not giving the ECU the time it needs to adapt and then optimize the performance of any of the intakes. Could it be that the ECU could adapt to the intakes to make better power than recorded in the test and further differentiate itself from the others?

6th Gear
Joined: Aug 2002
Posts: 2,253
Likes: 0
From: NY NY
so the conclusions are:
for a stock motor, and compared to stock:
torque maxes are so close for all the intakes, they are indistinguishable (1/144 is only .7%);
hp is +10 Alta; +6 Pilo. +4AGS; (a differential of 6/160=3.7%).
max hp increase was 10/160=6%; not bad for an intake only change.
My guess is that for an intake design like the AGS, you might see a relative improvement on a better breathing car. Next test: head, pulley, header as the baseline.
as far as all the flutter about 0-60 times, get your cars out on the dragstrip and post some real world results comparing intakes.

6th Gear
Joined: Oct 2002
Posts: 3,652
Likes: 6
From: Lansdale, PA
Originally Posted by BrianGT
Here are them all on one sheet:
Excel sheet:
http://www.chipamp.com/diyaudio/mini-dyno.xls
1,2,3 (stock)
4,5,6 (pilo)
7,8,9 (alta)
10,11,12 (ags)
Assuming 13 and 15 are the additional ags runs...
--
Brian
Excel sheet:
http://www.chipamp.com/diyaudio/mini-dyno.xls
1,2,3 (stock)
4,5,6 (pilo)
7,8,9 (alta)
10,11,12 (ags)
Assuming 13 and 15 are the additional ags runs...
--
Brian
I still say it's foolish to draw conclusions from cherry-picked runs within the groups, but we don't have any other data so far. Here's my spreadsheet with runs 2,4,6,and 11.
http://www.ross-tech.net/andy/mini/i...ieintake01.xls
Here's some graphs. First, HP and Tq vs RPM for each intake:
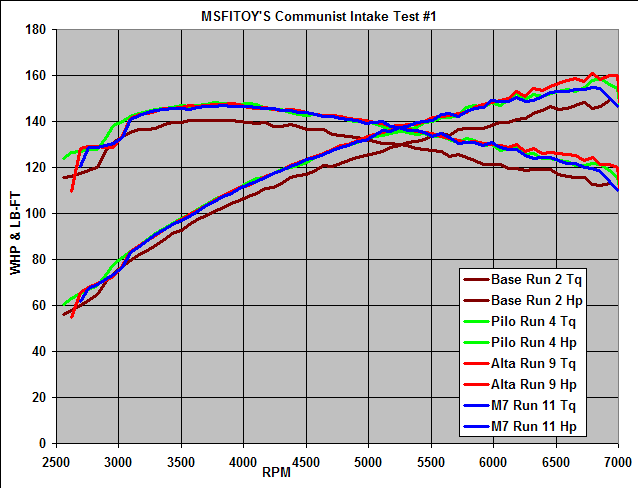
Looks like ALL of the aftermarket intakes deliver very similar performance over stock, across the RPM band. The 3 intakes' curves really don't begin to separate until after 6k rpm, where the Alta takes the lead.
Next is a graph of the the torque gains for each intake compared to stock, as well as a curve showing the torque difference between the Alta and M7:
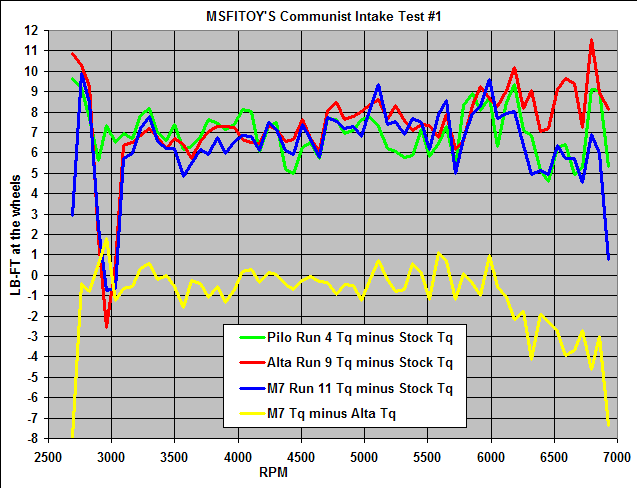
Average torque gains from 2690 rpm to 6927 rpm (the common ground between those four tests) are as follows:
Pilo: 6.99 lb-ft
Alta: 7.36 lb-ft
M7: 6.38 lb-ft
There are 64 data points for each run (from 2690 rpm to 6927 rpm). Comparing the Alta and M7, the Alta beats the M7 in 49 of these, and the M7 beats the Alta in 15 of these.
Again, having data for all 3 runs from each intake would allow averaging for smoother graphs and would help eliminate variations due to noise. From the data shown in those four runs so far though, I don't see how anyone can claim that the M7 beats the Alta, let alone the Pilo.


6th Gear
Joined: Jan 2005
Posts: 1,719
Likes: 1
From: New Brunswick, NJ
Originally Posted by andy@ross-tech.com
I still say it's foolish to draw conclusions from cherry-picked runs within the groups, but we don't have any other data so far. Here's my spreadsheet with runs 2,4,6,and 11.
You used discrete 'points in time' and cite an absolute number of cases where xyz happens, but you fail to consider that a car accelerating spends less time at higher speed than it does at lower speeds. You will need to re-draw your graph with a higher proportion of space taken up by the lower speeds in order to approximate the process of acceleration. This will help to reflect what we all know empirically, that the speed of accelerating is more dependent on low end power than high end power. You would need a logarithmic-type curve to directly compare the data you chose to compare.
If you go strictly by time, like I did, you don't have any inherent error due to sampling. You have direct, deductive data. Please reconsider your data analysis methods. You are violating your own statistical rules (don't draw conclusions based on incomplete, discrete data when your set is continuous.)
6th Gear
Joined: Oct 2002
Posts: 3,652
Likes: 6
From: Lansdale, PA
I don't follow your reasoning. If you start each run at the same speed (40 mph) and end at the same speed (103 mph), you have:
Stock: 14.44s
Pilo: 13.23s
Alta: 13.21s
M7: 13.29s
It looks to me like the finishing order is still the same as shown in my graphs.
You can't use data from speeds below 40 or above 103 since data points don't exist there for the 4 intake configurations, so you would not be comparing apples to oranges.
Originally Posted by ingsoc
Andy, I think you've made your own error in analysis in treating your data like a discrete set. It is not discrete but CONTINUOUS nd must be treated that way. If you pay close attention to the data that I presented AND the way I presented it, you will notice a clear but subtle difference between what I did and what you did- These discrete data points are not enough to extrapolate performance over the run. I used TIME because I know that time is continuous and using time avoids the pitfalls of using individual discrete points- in essence, if you know the time from start to finish, you can't have ANY error due to sampling (only beginning and ending conditions are utilized).
You used discrete 'points in time' and cite absolute number of cases where xyz happens, but you fail to consider that a car accelerating spends less time at higher speed than it does at lower speeds. Therefore, in acceleration, the speed of accelerating is more dependent on low end power than high end power. You would need a logarithmic-type curve to directly compare the data you chose to compare.
If you go strictly by time, like I did, you don't have any inherent error due to sampling. You have direct, deductive data. Please reconsider your data analysis methods. You are violating your own statistical rules (don't draw conclusions based on incomplete, discrete data when your set is continuous.)
6th Gear
Joined: Oct 2002
Posts: 3,652
Likes: 6
From: Lansdale, PA
Again, looking at just the Alta and M7 using time and speed, from:
40-50: Alta faster than M7 (2.09s -vs- 2.10s)
50-60: Tied at 1.94s
60-70: Tied at 1.98s
70-80: Tied at 2.05s
80-90: Tied at 2.17s
90-100: Alta faster than M7 (2.32s -vs- 2.27s)
40-50: Alta faster than M7 (2.09s -vs- 2.10s)
50-60: Tied at 1.94s
60-70: Tied at 1.98s
70-80: Tied at 2.05s
80-90: Tied at 2.17s
90-100: Alta faster than M7 (2.32s -vs- 2.27s)
Thread Starter
|
OVERDRIVE
Joined: May 2003
Posts: 7,926
Likes: 40
From: Greensboro, NC
Originally Posted by kaelaria
Won't it be hillarious to see the excuses, after the next dyno round shows the same results! LOL
6th Gear
Joined: Jan 2005
Posts: 1,719
Likes: 1
From: New Brunswick, NJ
Originally Posted by andy@ross-tech.com
Again, looking at just the Alta and M7 using time and speed, from:
40-50: Alta faster than M7 (2.09s -vs- 2.10s)
50-60: Tied at 1.94s
60-70: Tied at 1.98s
70-80: Tied at 2.05s
80-90: Tied at 2.17s
90-100: Alta faster than M7 (2.32s -vs- 2.27s)
40-50: Alta faster than M7 (2.09s -vs- 2.10s)
50-60: Tied at 1.94s
60-70: Tied at 1.98s
70-80: Tied at 2.05s
80-90: Tied at 2.17s
90-100: Alta faster than M7 (2.32s -vs- 2.27s)


6th Gear
Joined: Jul 2004
Posts: 2,664
Likes: 1
From: Orlando, FL
Originally Posted by andy@ross-tech.com
Again, looking at just the Alta and M7 using time and speed, from:
40-50: Alta faster than M7 (2.09s -vs- 2.10s)
50-60: Tied at 1.94s
60-70: Tied at 1.98s
70-80: Tied at 2.05s
80-90: Tied at 2.17s
90-100: Alta faster than M7 (2.32s -vs- 2.27s)
40-50: Alta faster than M7 (2.09s -vs- 2.10s)
50-60: Tied at 1.94s
60-70: Tied at 1.98s
70-80: Tied at 2.05s
80-90: Tied at 2.17s
90-100: Alta faster than M7 (2.32s -vs- 2.27s)
6th Gear
Joined: Oct 2002
Posts: 3,652
Likes: 6
From: Lansdale, PA
Originally Posted by ingsoc
You CAN compare below 40 based solely on the continuous variable- time. The dyno is run by matching the revs to a standard, then beginning logging on the computer and simultaneously jumping on it.
Okay, you and I decide to race. I'm going 50, you're going 60. We both floor it at the same time and stop when we each hit 100. You got there first. You win! Yay! :impatient
6th Gear
Joined: Jan 2005
Posts: 1,719
Likes: 1
From: New Brunswick, NJ
Originally Posted by andy@ross-tech.com
Have you actually seen/operated a dyno?
Okay, you and I decide to race. I'm going 50, you're going 60. We both floor it at the same time and stop when we each hit 100. You got there first. You win! Yay! :impatient
Okay, you and I decide to race. I'm going 50, you're going 60. We both floor it at the same time and stop when we each hit 100. You got there first. You win! Yay! :impatient
The ALTA went from 39 to 40 in .32 s with 54.71 hp at 39. The AGS went from 39 to 40 in .68 s. and with a power of N/A at 39, meaning the throttle was off for a significant amt. of the interval. So, by any measure, it was the ALTA which got the jump. Now, even supposing [wrongly, as I just showed, the ALTA got the jump at first] that the run was fair, the AGS pulls even at 90 mph [10.24 s. 40 to 90, whereas ALTA takes 10.23s.]. Clearly, therefore, even with the ALTA's jump off the line, the AGS makes more power up through 90 mph because it PULLS even. Quod erat demonstratum.
If you started them off the line, and each got an equal jump, this data shows that the AGS would pull early on. Perhaps it would even pull up top.

Manufacturer
Joined: Dec 2002
Posts: 995
Likes: 0
From: Oregon
What Andy and The DR. finally hit on is that using the start time to end time doens't work. The ONLY way to compare numbers is by using the speed (which is RPM) and what HP they all make at the same speeds. The guy running the dyno could have hit START sooner or later on all the intakes cause the start time to be off making one intake look faster to 60MHP. The real case is what Andy stated that comparing 40-104MPH and the time each took to get there will show which is quicker.
In a drag race the intake with the most WHP (under the curve) gets down to the end quicker. Saying that one intake on these dyno runs got to 104MPH quicker than another doesn't work.
comparing the 40-104MPH
pilo (2runs) gets there in 13.82 and 13.85sec.
Alta, (1 run)13.45 sec
AGS (3 runs)13.55, 14.17, 14.56
This shows which car will be quicker.
6th Gear
Joined: Oct 2002
Posts: 3,652
Likes: 6
From: Lansdale, PA
Originally Posted by kapps
If the Alta either ties or beats the M7 in every section, then how is it that they both reach 101 mph within .03 s of each other - with the AGS being the faster of the two? Also, if the Alta is making much more hp than the AGS at the top end, then where is the AGS making it up if your torque figures are basically identical between the two?

6th Gear
Joined: Apr 2003
Posts: 1,160
Likes: 0
From: Orange County, CA
I think your time would be better spent arguing about what the best way is to help the people who lost everything they own, and who's lives were destroyed by the hurricanes. Instead you are arguing about pointless, useless information that really makes absolutely NO difference in anyone's lives. Thinking in terms of the grand scheme of things, who cares?
It just really bums me out I guess...
It just really bums me out I guess...
Manufacturer
Joined: Dec 2002
Posts: 995
Likes: 0
From: Oregon
ingsoc,
Your post was made while i was still typing. PLease don't think i am arguing against you.
Some other things i found is that if you take the 50,60,80,100MPH and compare the WHP numbers (average of the above and below numbers) you get:
AGS ALTA
50MPH 93.06 92.99
60MPH 112.42 112.47
80MPH 139.13 139.13
100MPH 154.27 158.96
Basically this shows that one car with the ALTA and one car with the AGS will be neck and neck until 6000. So neither one has more low end power than the other, only one has more power above 6000. In a drag race since about 30% of your time spent above 6000, one car will be faster, but not by much.
Love the great data people put together, it is fun to see how everone interpets it differently. I believe Randy finish his data on his AGS, PILO, HAI, stock, ALTA comparo. People should start bugging him to release it.
Thread Starter
|
OVERDRIVE
Joined: May 2003
Posts: 7,926
Likes: 40
From: Greensboro, NC
Originally Posted by ALTA2
Love the great data people put together, it is fun to see how everone interpets it differently.
Originally Posted by MSFITOY
Thanks again to all you supporters for making this happen. We look forward to the fireworks to come